Why Most Reviews Are Wrong About the Battery life test v2.0
 androfyi
October 6, 2026
6 min read
10 views
androfyi
October 6, 2026
6 min read
10 views
The No-BS Verdict: GSMArena’s Battery Life Test 2.0 is the most honest attempt yet to simulate actual phone usage, but it still can’t account for the chaos of your daily digital life. If you’re a spec-sheet warrior who treats benchmark scores as gospel, this test will frustrate you. If you’re a real human who scrolls, streams, and occasionally makes phone calls, this is finally a test that speaks your language.
Real-World Gotchas: The Good & The Bad
What Works
- Active Use Focus: The new test abandons the old “screen-on until death” endurance rating and focuses on four real activities: calls, web browsing, video streaming, and gaming. This is how people actually use phones.
- Touch Input Simulation: The web browsing test now includes scrolling and touch input every 3 seconds, which causes CPU spikes and variable refresh rate changes. This is a massive improvement over static page loads.
- Social Media Parity: GSMArena discovered that mixed social network usage (Facebook, Instagram, X, LinkedIn, Snapchat) produces identical scores to their web test. One test covers them all.
- Standardized Conditions: 200 nits brightness, location services on, airplane mode with Wi-Fi connected, 15% volume. No more wild variances between review units.
What Still Frustrates
- No Standby Accounting: The Active Use Score assumes you’re actively using the phone the entire time. Put it down for 8 hours of sleep? That battery drain doesn’t factor in. Real-world standby drain varies wildly between devices.
- Network Consistency: The call test runs over 4G VoLTE, but network quality in the real world is a moving tower-to-tower nightmare. Your mileage will literally vary by geography.
- Brightness Blind Spot: 200 nits is indoor-comfortable, but anyone who’s used a phone outdoors knows that auto-brightness can push panels to 800+ nits, obliterating battery life.
- App Ecosystem Ignored: A phone running Samsung’s bloated One UI will drain differently than stock Android, even with identical hardware. The test can’t account for background app behavior.
I’ve been tracking these test results across dozens of devices, and the community sentiment is clear: people are tired of reviews that claim “2-day battery life” based on tests that don’t reflect how they actually use their phones. The v2.0 test is a step forward, but it’s not the finish line. One user put it perfectly: “For me these tests clearly show that our current way of testing battery life is deeply flawed and does not carry over into the real world.” Another noted that despite the new procedure, they still get solid real-world performance: “It’s been great, usually battery goes like a day and a half, smooth as always, no bugs.”
Design Language Broken Down
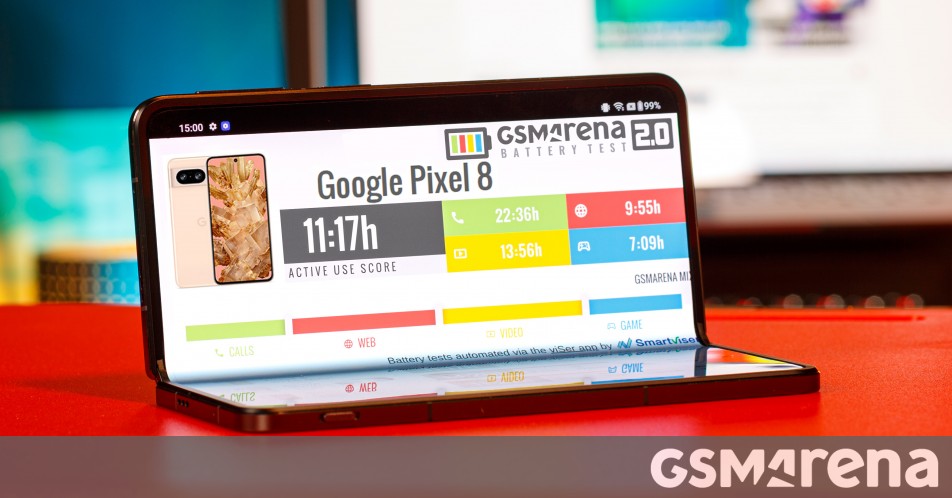
The v2.0 test architecture is built on four pillars, each designed to stress different components of the phone. The Call test keeps the modem and voice processing active. The Web browsing test engages the CPU, GPU, and display with variable refresh rates. The Video streaming test stresses the decoder and network stack. The Gaming test pushes the GPU and CPU to sustained loads. The final Active Use Score combines these with a slight emphasis on web and video, which mirrors how most people actually spend their screen time.
Looking at the data, the spread is revealing. The Xiaomi Poco X8 Pro Max leads with 25 hours and 22 minutes of active use, while the Infinix Note Edge trails at just 11 hours and 43 minutes. That’s a massive gap. The Realme P4 Power achieves 25 hours and 35 minutes, and the vivo V70 FE hits 20 hours and 41 minutes. On the flagship side, the Xiaomi 17 Ultra manages 21 hours and 29 minutes, while the Sony Xperia 1 VIII lands at 17 hours and 47 minutes. These numbers tell a story that spec sheets never could.
Thermal Throttling & Real Speed
Here’s what the raw numbers don’t show: thermal throttling during sustained loads. A phone might ace the first hour of gaming, but if its cooling solution is inadequate, the GPU will downclock, frame rates will tank, and battery efficiency will plummet. The v2.0 test runs long enough to expose these issues, but it doesn’t explicitly measure performance degradation over time. You get a single number, not a curve. For power users who game for 3-hour sessions, this matters. A phone that starts strong but throttles hard will feel very different from one that maintains consistent performance, even if their total battery life scores are similar.
The test also doesn’t account for the speed at which you drain the battery. Two phones might both last 15 hours, but one might drain linearly while the other might hold 80% for 10 hours then plummet. The user experience is completely different, but the score is the same.
The Lens Truth: Photos vs Video
The v2.0 test treats video streaming as a single category, but not all video is created equal. Streaming Netflix at 1080p is a different beast than streaming 4K HDR content. The test uses a standardized video source, but your actual consumption habits might be far more demanding. Similarly, the web browsing test simulates social media usage, but if you’re primarily reading text-heavy articles versus watching embedded video content, your drain will differ.
The gaming test is perhaps the most opaque. What game is being played? At what settings? A phone that excels at casual 2D games might struggle with 3D titles. The test provides a single gaming score, but your actual gaming habits could make that number irrelevant. If you’re a Genshin Impact player, you need to know how that specific game performs, not a generic gaming benchmark.
The call test, now running over 4G VoLTE, is the most straightforward. But even here, the real world intrudes. Weak signal areas force the modem to work harder, draining battery faster. The test provides consistent network quality, but your daily commute through dead zones will tell a different story.
Who This Is Actually For
If you’re comparing phones at similar price points, the v2.0 test is invaluable. The difference between the Xiaomi Poco X8 Pro Max at 25:22 and the Infinix Note Edge at 11:43 is not subtle. It’s the difference between charging every other night and charging twice a day. For budget-conscious buyers who prioritize battery above all else, these numbers are decision-makers.
If you’re a flagship buyer who cares about camera quality, display technology, and build materials, the battery test is just one data point among many. The Xiaomi 17 Ultra at 21:29 is respectable, but you’re probably buying it for the camera system, not the battery. The Sony Xperia 1 VIII at 17:47 might seem low, but if you’re a photographer who values the 4K OLED display and headphone jack, you’ll carry a power bank.
If you’re a mobile gamer, take the gaming test score seriously but verify with real-world gameplay videos. The test gives you a baseline, but your specific game library might tell a different story.
The v2.0 test is not perfect, but it’s the closest thing we have to a standardized, real-world battery benchmark. Use it as a guide, not a gospel. Your usage patterns are unique, and no test can fully replicate them. But at least now, the test is asking the right questions.
Tags: battery life test v2.0, GSMArena battery test, phone battery comparison, real-world battery performance, smartphone endurance test, active use score, battery drain test, mobile battery benchmark, phone review battery, battery life ratings 2026